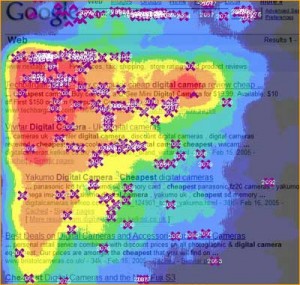
If you’ve ever looked at a radar image of an oncoming storm (something we haven’t exactly seen a lot of lately in the South), you know that the deep reds and purples can be somewhat fearsome because they carry significant potential for damage. The radar method of displaying information is called a “heatmap”. We wondered – what if there was a way to apply a heatmap of user activity to your website? Well, that’s something we developers and programmers are working on – a heatmap of clicks for your website.
 Into every website, a little forethought must be given – how to guide the user, designing clear calls to action, and effectively displaying the overall message. We often rely heavily on website analytics to craft reports that help us identify how a site is performing and where improvements can be made. We’re working on technology that will log where users click on your site to further give our users information about their site.
In the image, you can see a heatmap of some Google search results. This information is powerful. You can clearly see users follow a pattern: users look at the top few results, and if they aren’t satisfied, many will attempt to search again. This heatmap handily represents a sizeable portion of user activity.
We knew you’d also want a hands-on demo. We’re working on expanding similar technology to actively save user’s information. We’re all very excited to be working on this technology and hope that it will yield great success for our clients. If your interested in getting in on some early beta testing, let us know.
Now if you’ll excuse me – I’m going to work on my rain dance technique.

